


Introduction
We love to meet foreign value managers. We are often impressed by their global view, deep knowledge of many different industries, and their unique take on Japanese companies. Also, they speak the same language as us. We cannot find many Japanese market participants who speak the language of value investing. So, by talking to them, we feel less lonely as value investors in Japan.
Over the last few months, we had the opportunity to meet with several such managers, from both large firms and smaller boutiques. Although they each have slightly different investment philosophies, all of them believe that investing in carefully selected Japanese companies will generate strong returns going forward because of low valuations despite the high quality of the businesses.
Especially compared with other developed countries, they believe opportunities in Japan stand out (S. Korea is also quite attractive). We debated with them why so many high quality Japanese companies are (still) undervalued. The following 4 themes kept coming up as reasons for persistent undervaluation:
- Too many (tiny) public companies
- Poor quality of sell-side research
- Lack of proper capital allocation by executives
- Shortage of value investors
We found these discussions elucidating and did some additional work on each issue. The following are some findings we would like to share with you.
1. Too many (tiny) public companies?
Some investors believe the Japanese stock market is inefficient because there are simply too many public companies, especially tiny ones. They all agree that many of these tiny companies would not be public if they were domiciled outside of Japan. Such tiny Japanese companies are not investable for most institutional investors.
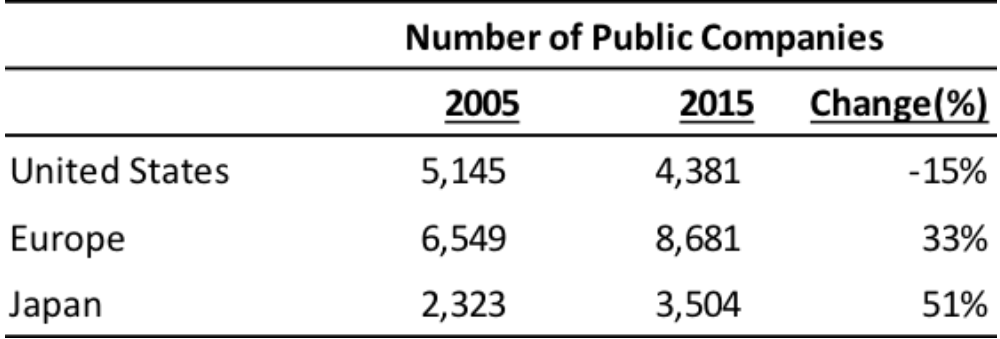
Japan has about 3,500 public companies. While this is fewer than in the US or Europe (see Table 1), we see this as an excessively large number for a few reasons:
- The number of public companies in Japan grew by 51% in the last 10 years, much more than in the US or Europe. In the US, many companies have decided to go private because of the increased cost of remaining public and the significant influence activist shareholders can wield against underperforming companies. Also, a highly active M&A market has forced consolidation across multiple industries. As a result, the number of US public companies actually decreased 15% over the past 10 years. In Europe, the number of public companies grew 33% in the last decade, trailing Japan. The Japan Exchange Group, the parent company of the Tokyo Stock Exchange, targets about 100 IPOs per year in its mid-term business plan[1].
- Relative to GDP or population, Japan has more public companies than the US or Europe. The GDP of the US is 4 times that of Japan, while the population of the US is 2.5 times bigger. Yet the number of public companies in the US is just 1.25 times that of Japan. So, to be consistent with US norms, Japan should only have 1,052 – 1,730 public companies.
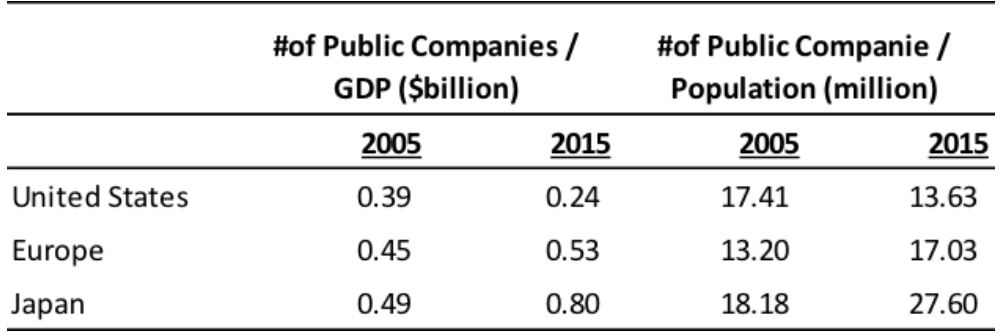
Table 2. Number of Public Companies per GDP and Population – Source: World Bank - If we define microcap stocks as below a $300 million market cap, about 70% of Japanese public companies fall into this category. If we define nanocap as below $50 million, still a quarter of Japanese public companies fall below this threshold. In the US and Europe, the number of public companies below $50 million is only about 10% of the total.
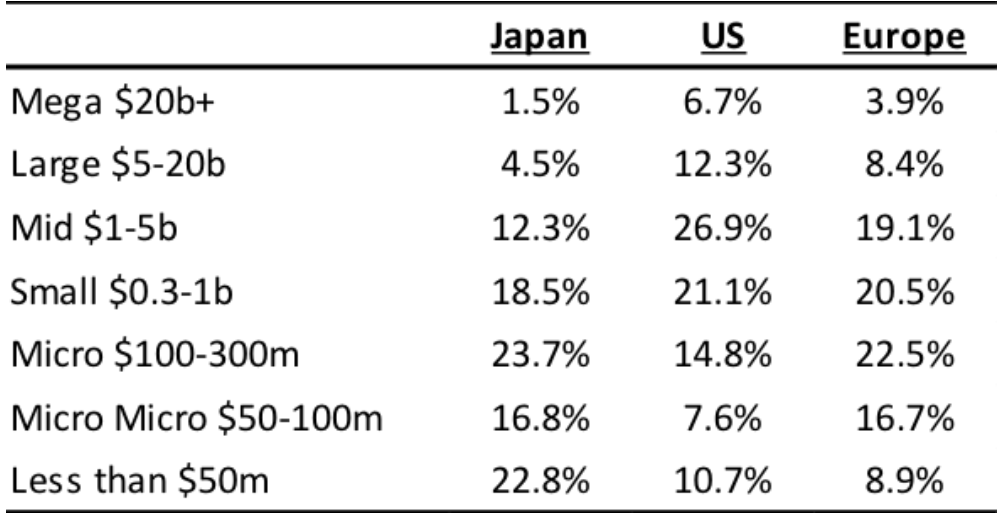
Table 3. Market Cap Distribution of Public Companies – Source: Bloomberg
We believe the uniqueness of Japan stems from motivations and cost. According to a 2016 Teikoku Data Bank survey[2], the top 3 reasons for companies going public in Japan were:
72.4% Improve name recognition or credibility
66.3% Recruit (talented) employees
52.6% Improve financing capabilities
According to a survey by James C. Brau and Stanley E. Fawcett[3] in 2006, US companies go public primarily to:
- Create public shares for future acquisitions
- Establish a market price for the firm
- Enhance reputation
- Minimize the cost of capital
We are surprised that “enhance reputation” received such a relatively high score in the US. In general, US companies go public for financial reasons while Japanese companies do so more for non-financial reasons. By going public, they want to be known as an elite firm that everybody wants to do business with or work for.
Sachio Senmoto, former chairman of eAccess, told us an interesting story. He sold his company to Softbank for a premium of more than 200% in 2012. Many of his non-Japanese friends sent emails congratulating him on the great deal. On the other hand, many of his Japanese friends sent emails saying they were sorry to learn Mr. Senmoto’s company would be delisted because of the takeover. Some of them even apologized that they did not offer to “help” Mr. Senmoto (who most certainly did not need any help).
We usually ask Japanese CEOs why they took their companies public, and many of them tell us it was to improve name recognition and recruiting. The weirdest answer we received was: “We went public to reduce potential inheritance tax burdens because the IPO share price was expected to be below book value.” We were speechless.
We frequently witness debt-free, cash-rich companies launching IPOs by issuing new shares. Japanese investment bankers recommend doing so to maximize their fees. Since many CEOs go public for non-financial reasons anyway, they often blindly follow “expert” advice.
Even though being a public company carries some prestige in Japan, we think many companies would not go public if the costs were higher. Apparently, total cost of being a public company is not very expensive in Japan. For example:
- The NYSE minimum annual fee is $59,500. In Japan, the minimum annual fee is $8,700 for TSE 1st Section
- Average fees paid to auditors by Japanese public companies are 1/7th the level of US public companies[4].
- The number of shareholder class action lawsuits in Japan are less than half that of the US and settlements tend to be much smaller.[5]
In Japan, people consider companies on the Tokyo Stock Exchange 1st Section to be the best of the elite. This is because people think there are many hurdles to listing shares on the TSE 1st section. It is true that listing shares on the TSE 1st section in an IPO is not easy. For example, you need to have an initial market cap of at least 25 billion yen or $235 million (remember 70% of Japanese public companies have less than $300 million in market cap). But, interestingly, about 60% of public companies are traded on the TSE 1st section. Why? It is because there is a loophole. If you list shares on the TSE 2nd section first, then move up to the 1st section later, the market cap hurdle goes down to just 4 billion yen or $36 million (remember 80% of Japanese companies are bigger than $50 million). Many companies take advantage of this loophole to join the group of the best.
To keep your shares on the TSE 1st section, you need to have at least 2,000 shareholders. This is not easy for some small cap companies. Since they are small, they have few institutional investors and need to attract retail investors. As a result, many companies implement gift programs. For example, if you are a retail investor who owns 100 shares of Nissin Foods Holdings (TSE: 2897, 6,500 yen per share), you will receive 1,500 yen worth of Cup Noodles twice a year, in addition to a dividend of 80 Yen per share. Your “yield” becomes (1,500 + 1,500 + 80 X 100) / 650,000 = 1.69%. If you are an (unfortunate) institutional shareholder who owns a million shares, your yield is only 1.23% because you are not eligible to receive a truckload of Cup Noodles. If the company does not have appropriate products or services to give out to retail investors, they will give a cash voucher called a Quo Card, usually 1,000 yen per year. If the share price is 1,000 yen and the minimum lot is 100 shares, this will increase the yield by 1%. Believe it or not, over 1,300 companies, more than a third of all public companies, have such gift programs. In total, they spent about 100 billion yen (over $900 million) or 2% of net income for gifts.
This brings us to Mr. Kiritani, a former professional shogi (Japanese chess) player, and the most famous investor in Japan. He lives entirely off shareholder gifts from his $1.5 million portfolio containing over 500 companies. His stock picking criteria is simple: a total yield of over 4%, including the gift. Since many of these gifts, such as Tokyo Disney Land tickets or food and drink at restaurants, have an expiration date, he has comically busy days traveling around Tokyo on his one-gear bike trying not to waste any of them. Assuming a gift yield of 2%, he is getting $30,000 worth of gifts per year. This is tax-free income for him, but for companies the cost cannot be counted against pre-tax profits.
Mr. Kiritani on his bike

This gift program causes many retail investors to buy and sell shares around the rights ex-date. These days, some retail investors buy shares in cash accounts and simultaneously sell them in margin accounts just to get rights for the gift and dividend. The 2,000-shareholder requirement also has some impact on capital allocation decisions. When we asked net-net companies in Japan why they don’t institute share buybacks at obviously super cheap share prices, most of them say they are concerned about reducing float, which will decrease the number of shareholders. We think equal treatment of shareholders is one of the most important principles of effective capital markets. Additionally, gifts can entice naïve individual investors to invest for the wrong reasons, potentially resulting in destruction of their savings by poorly managed companies. Therefore, we dislike these gift programs. We find it embarrassing that Mr. Kiritani is Japan’s most famous investor, while other countries have Warren Buffett, Jean-Marie Eveillard or Li Lu.
2. Quality of sell-side analysts
Many value managers we have met with complained that the quality of Japanese sell-side analysts is quite low and it may be one of the reasons high-quality businesses are often mispriced. Each of the managers described Japanese sell-side analysts in different words: One portfolio manager described them as “criminally bad” and thinks they should be thrown in jail. Another portfolio manager said the spread in Japan between business quality and sell-side analyst quality is the widest in the world.
We usually do not rely on sell-side reports because:
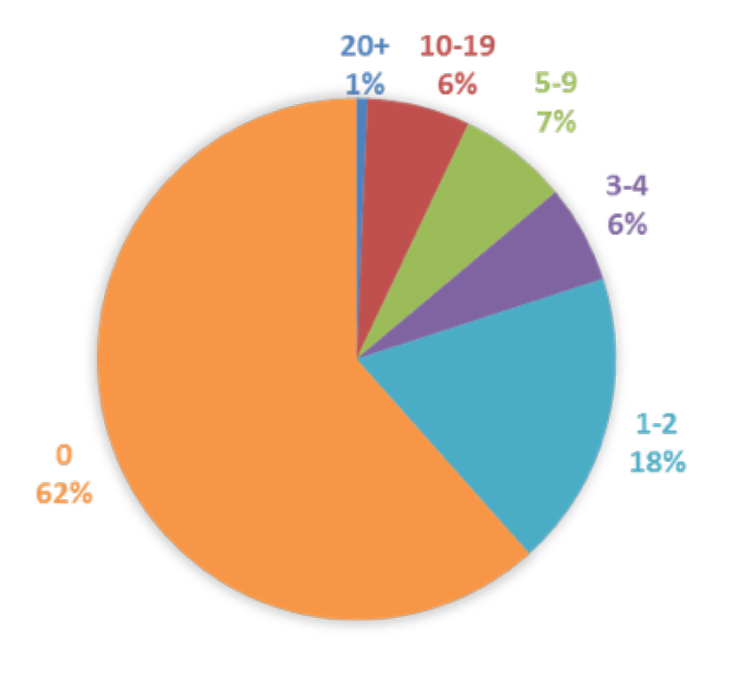
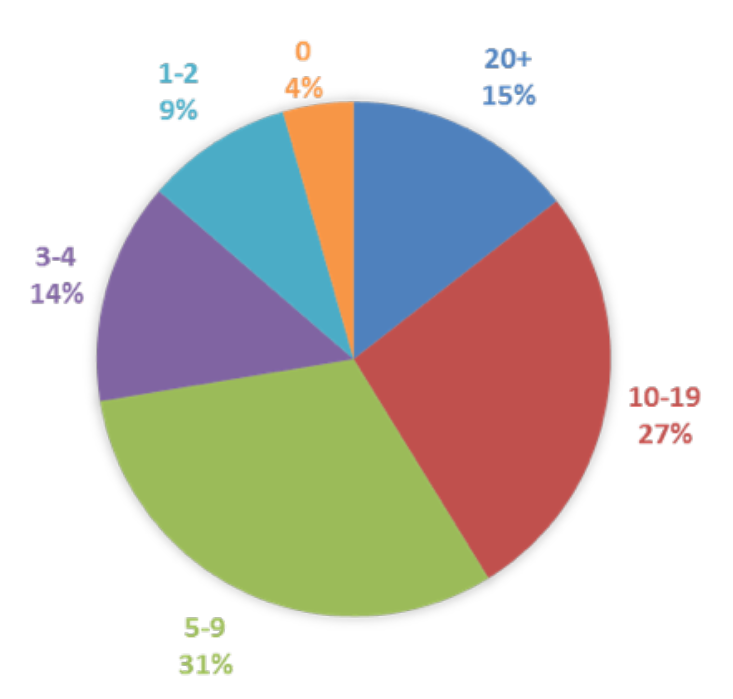
- Many public companies, especially small caps, have no analyst coverage. Here are some comparisons of analyst coverage between all Japanese public companies vs. the Russell 3000:
- Companies with no analyst coverage: Japan 62% vs. US 4%
- Companies with more than 10 analysts covering: Japan 7% vs. US 42%
- Companies below $300 million with no coverage: Japan 87% vs. US 15%
- Lack of fundamental detail: Even when a target company has analyst coverage, we usually find the analyst reports to not be very informative. There are usually two types of sell-side reports: 1) lengthy reports for initiating coverage, and 2) smaller reports for updates. The short reports usually just copy and paste the company’s press releases. There is no insight offered. Ultimately the report may only be useful for someone who cannot read Japanese since it provides an English translation. For long reports, they tend to be a summary of past company presentations. Once again no insight is offered. Since we usually attend analyst meetings and read company disclosures in the original, these sell-side reports are usually not very informative.
- Short-term orientation: Value investing is long-term by definition. Our average holding period is over 5 years. Most sell-side research, however, tends to focus on target prices using a 12-month horizon, with most attention paid to developments in the current or upcoming quarter. They offer 5-year earnings forecasts, but usually just extrapolate current trends forward.
- Strong bias for price-to-earnings valuations: target prices are calculated mainly using price-to-earnings ratios. Since they pay little attention to the balance sheet or cash flows, they tend to undervalue cash rich or asset rich companies and overvalue levered companies. When there are accounting changes that do not impact cash flows, but have a large impact on reported earnings, they change target prices accordingly. We think about the true value of companies as if we own 100%. If you become a 100% owner of a company, the company’s cash will be your cash and its liabilities will be your liabilities. So, for us, careful assessment of each item of the balance sheet and cash flow is as important as items on the income statement. We tend to see a big difference between our estimates of intrinsic value and the sell-side’s 12-month target price.
We feel sympathy for sell-side analysts. Every time, we read news about cost-cutting programs at brokerages, analysts (especially those covering small caps) are the first victims. Since they are usually quite smart people, there should be rational reasons why they work this way. We have interviewed several sell-side analysts to understand why. Here is what we found:
- Shrinking number of analysts: Everybody told us that the number of analysts is shrinking in Japan, especially at foreign-owned brokers. As commission rates have come down, the equity execution business is no longer profitable for most brokers once the cost of the research team is included. A 2013 Nikkei newspaper article said the number of analysts at seven major foreign brokers declined by 25% from the peak in 2007[6]. We learned that Level 2 applicants for the CMA (required to become a Chartered Member of the Securities Analysts Association of Japan) exam declined from about 4,000 per year during 1997-2002 to about 2,000 per year these days. For the same period, Level 3 applicants of the globally-recognized Chartered Financial Analyst (CFA) exam grew from about 5,000 to about 30,000. Japan’s global share of newly awarded CFA charter holders was just 0.6% in 2014.
- Number of public companies↑/number of analysts↓: While the number of analysts materially declined, the number of public companies grew in Japan as we saw in the previous section. Thus, each analyst must cover more and more companies or many public companies get no sell-side coverage. Analysts told us most sell-side analysts cover 15-25 companies. It’s easy to see why they might lack the time to perform much, if any, detailed analysis on companies.
- Different incentives: we were very surprised when we learned that sell-side analysts’ incentives are not tied to the quality of their research. Some told us that ratings, accuracy of earnings estimates, and quality of contents do not really matter for their evaluation. Instead, they are required to provide good service to Tier-1 clients in order to get high broker ratings from them. Tier-1 clients are usually high-turnover hedge funds or large long-only asset management firms. To get good ratings from hedge funds, you need to provide them with short-term investment ideas. To get positive feedback from large long-only firms, you need to help their internal buy-side analysts. Buy-side analysts do not need investment opinions from the sell-side. Instead, they appreciate help from the sell-side on data, fact gathering, and arranging meetings with companies.
According to a Japanese proverb, “the nail that sticks out gets hammered in.” We also believe most sell-side reports are not very interesting because there is a strong tendency toward groupthink. The universe covered by most major sell-side firms are similar and they publish similar reports. Because they are not paid for being different, it makes no sense to take risk to do so.
It can be risky to stick out, especially because many companies do not respect the principle of analyst independence. About 10 years ago, a JPMorgan analyst put a sell rating on Rakuten. Shortly afterwards, Rakuten complained about the report to JPMorgan. JPMorgan withdrew the report and apologized to the company. The analyst left JPMorgan a few months later. In 2013, a Mitsubishi-UFJ Morgan Stanley analyst wrote a report downgrading Rakuten (again) from Neutral to Underperform. Rakuten issued a press release stating that investors should disregard the report because it did not contain a detailed analysis of business segments, used the wrong tax rate, and used an inappropriate formula to calculate the target price. The press release also said Rakuten would no longer take meetings with the analyst. The analyst still works for Mitsubishi, but stopped coverage of Rakuten at the end of 2013. Today, 20 analysts cover Rakuten and there are no sell ratings, while the company has been busy writing off goodwill from past foreign acquisitions (including Kobo, PriceMinister and Buy.com). In short, we found being a sell-side analyst in Japan is a very tough job these days.
Sell-Side Research Example: Cyberdyne (7779)
We found some sell-side analysts use “creative” formulas and assumptions to calculate target prices, which could be very misleading for many investors. For example, on April 6, 2017 one of the largest brokerage firms published a 59-page initiation report on Cyberdyne (TSE: 7779) with an Outperform rating and target price of 2,080 yen or 30% upside. Cyberdyne is a manufacturer of service robots and one of the most expensive stocks in Japan with over $3 billion in market cap and over 200x EV/LTM Sales (compared to Cyberdyne, Tesla looks like a value stock at 8x EV/LTM Sales). So, we were curious how the report justified the target price.
The report said “Cyberdyne has remained in the red at the bottom line and is unlikely to post significant profits in FY18 even if it manages to move into the black. That makes earnings-driven valuation metrics inefficient.” So, the report used two formulas:
- “CapCash” This is a ratio we have never seen. It defines the CapCash ratio as market capitalization divided by net cash. For the last 10 quarters, Cyberdyne’s CapCash ratio averaged about 8.5 times. So, the author applied 10% +/- of 8.5x as the appropriate CapCash multiples to calculate his target prices. The analyst said CapCash is good because 1) this allow us to evaluate early-stage firms with continued losses, 2) “cash is king”, 3) cash & cash equivalents can change regardless of earnings performance, and 4) cash flow changes are reflected in the multiple as changes in cash & cash equivalents.
- Residual value based on mid-long term growth potential. The author estimates Cyberdyne’s 2026 sales at 34.1 billion yen based on a Total Addressable Market approach. Then, he assumed a 56% operating margin and 11.6x – 15.2x EV/EBITDA multiple, to calculate an enterprise value of 266.5 billion yen to 340 billion yen.
Cyberdyne has 77.7 million Class B shares and 137.3 million common shares outstanding. Class B has 10 times more voting rights than common shares while its economic interest is the same as common shares. Surprisingly, the author decided to ignore the existence of Class B shares, which control 85% of the voting power, to calculate the target price. He states it is appropriate because 1) the Tokyo Stock Exchange also excludes Class B shares when calculating its own market capitalization statistics, and 2) Class B shares have transfer restrictions.
We don’t quite understand how this report passed the company’s compliance department. We also noticed that of the 7 sell-side analysts covering Cyberdyne, 6 of them have buy ratings while 1 has a hold rating. Another analyst justified their target price by running a 20-year DCF with high growth expectations. As an aside, in our own valuation framework, we apply a multiple of 1x to net cash.
3. Poor Capital Allocation
For years value investors have been saying the lack of rational capital allocation policies is one of the main drivers of undervaluation in Japan. We discussed it in our letter from two years ago[7]. Since then, however, we have witnessed some improvements.
During 2016[8]:
- 474 companies, or about 25% of TSE 1st Section companies, announced buybacks (2015: 406 companies)
- Total buyback budgets were 5.7 trillion yen ($52 billion), +12.7% YOY
- Actual total buybacks were 5.2 trillion yen ($47 billion), +8.0% YOY
- Dividend payments totaled 11.8 trillion yen ($107 billion), +7.0% YOY
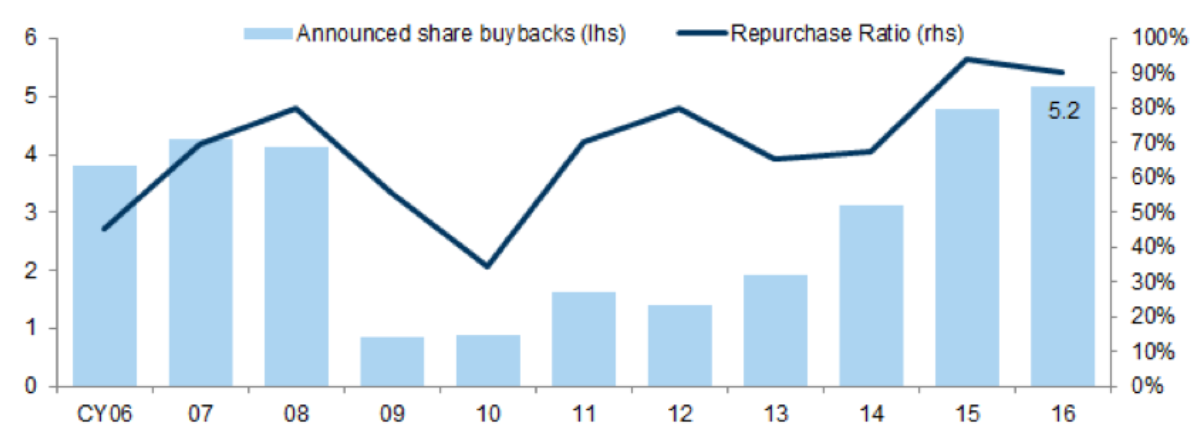
(TSE 1 Firms, Trillion Yen)
Although there were some improvements, Japanese companies still lag their US counterparts in terms of shareholder returns.
- Buyback yield[9]: Japan 1.1% vs. US 3.0%
- % of companies announcing buybacks: Topix 500 Index at 39% vs. S&P 500 Index at 80%.
Most market participants expect this trend to continue because 1) cash levels are still at record highs, 2) ROE levels remain low, 3) at AGMs, support for CEOs of low-ROE companies continues to decline, and 4) payout ratios at Japanese companies are still lower than those of foreign counterparts.
Much more remains to be done. A majority of CEOs still fail to adequately understand the benefits of proper capital allocation. However, the trend is quite encouraging.
4. Lack of value investors in Japan
In our discussions with foreign managers, we felt they are somewhat envious of our position in Japan because of our small AUM, our local presence and Japanese language skills, and the high quality of many Japanese companies that are also quite cheap. And they ask why aren’t there more VARECS-style value funds in Japan? Some of them attempted to identify funds like ours but found very few. We estimate there are 10-15 “true” value managers who specialize in the Japanese market, with a total AUM of $10-20 of billion. But most of the dedicated value managers we know with large AUMs are based overseas.
It is not easy to figure out exactly how many value managers exist in Japan. As a first step, we looked into Morningstar Japan’s public database of over 6,000 funds. Total assets in Japanese mutual funds are about 100 trillion yen ($909 billion). The database shows 959 domestic equity funds (including both public mutual funds and ETFs) with total AUM of 30.75 trillion yen ($280 billion). Within the “Value” category, the database has 146 funds with a total AUM of about 1 trillion yen ($9 billion). Morningstar’s value category includes some passive funds. For example, the two largest “value” funds are an ETF containing high dividend yielding stocks (AUM 93 billion yen or $840 million) and a fund of the Toyota group of companies (AUM 79 billion yen or $720 million) (see Table 4). When we exclude such passive funds, the number goes down to 114 funds with a combined AUM of 734 billion yen ($6.7 billion). As a comparison, the largest non-ETF mutual fund in Japan is Fidelity US REIT fund which has assets of 1.4 trillion yen or $12.8 billion. So, we can say the total AUM of all Japanese value funds represents just 0.73% of all mutual funds, 2.4% of all domestic equity funds, and about half the AUM of the largest fund in Japan.
When we look deeper into these “value” funds however, we find they do not really meet our definition of “true” value investors. They tend to employ very simple processes to pick names with criteria such as high dividend yields, low PBR, or low PER. Almost none of them attempt to calculate an intrinsic value and invest on that basis. Interestingly, their top holdings often overlap (popular names are banks, autos, and Softbank). They’re in the value category, but we think of them as more like index-huggers.
We also spoke to some companies which organize value investing conferences or publish value investing newsletters. We asked them how many Japanese clients they see for their products and services and although they could not give us specific numbers, they confirmed that very few are Japanese investors.
Jean-Marie Eveillard, a senior adviser at First Eagle, often said true value investors are very rare in the US, and even rarer outside it. He said that Bill Ruane of the Sequoia Fund figured out that no more than 5% of professionally managed money was invested on a value basis. He still thinks that is likely true today.
So why are there so few value investors even though many people think value investment works over time? Jean-Marie believes the answer is psychological. He maintains that if you are a value investor, you have to accept in advance that your performance will lag from time-to-time. And if you lag, you suffer. Jean-Marie, himself, felt the pain in the late 1990s when he refused to participate in the TMT bubble and consequently lagged badly. He lost 70% of his investors representing 2/3rd of his assets and his company was sold to First Eagle (then called Arnhold and S. Bleichroeder) by its parent Société Générale. He said, if you lag for one year, your clients are accepting. If you lag again for a second year, they get nervous. And if you lag for a third year, they are gone! It is safer inside the herd and thus terribly lonely to be a value investor.
If we relate this idea to the Japanese corporate culture, which is characterized by consensus-driven group thinking, it must be very difficult to pursue value strategies as it requires independent thinking and standing out from the crowd.
5. Conclusion
It may be true that we have too many public companies, our sell-side research is lousy, capital allocation is improving but still lagging and moving too slowly, and we have too few true value funds to unlock shareholder value. Also, other than capital allocation, the trends are not encouraging. The exchange wants to target 100 IPOs per year, sell-side analysts keep diminishing in number, and there are no signs that true value investing is catching on here. It sounds like a typical value-trap.
But we have conflicting thoughts on the situation. On one hand, many of these inefficiencies should be addressed for the long-term health of the Japanese economy. The Tokyo Stock Exchanges should tighten listing guidelines and other listing requirements, raise exchange fees, etc., to curb the ever-growing number of public companies, stop gift programs which we think are a total waste of money, and force tiny companies to go private again. Sell-side analysts should think more about how they can add value and spend more time introducing Japanese companies to long-term investors. All Japanese CEOs should read “The Outsiders” by William Thorndike and implement proper capital allocation policies as soon as practicable. The Japan Securities Dealers Association, the Government Pension Investment Fund, and/or the government should start a program to help launch value managers in Japan. This is the basic thinking of the last letter we wrote two years ago.
On the other hand, we feel these days it may be better for us and our investors if there is no change, or just slow improvement going forward. Maybe we should have too many small public companies. Maybe the sell-side should be short-termist and continue publishing millions of reports lacking in useful insights. Maybe CEOs should remain largely ignorant of investor demands. Then we are sure to have very limited competition for investment capital and opportunities. People may call us self-serving, but I guess good investment ideas should not be easily found. The current investing environment in Japan may well be our moat.
Jiro Yasu
Portfolio Manager
VARECS Partners Limited
jyasu@varecs.com
[1] Japan Exchange Group, “2nd Medium-Term Management Plan FY2016-FY2018”, March 22, 2016.
[2] URL of the survey: https://www.tdb.co.jp/report/watching/press/pdf/p160405.pdf
[3] “Initial Public Offerings: An Analysis of Theory and Practice” James C. Brau and Stanley E. Fawcett, The Journal of Finance, Vol. LXI, No. 1, FEBRUARY 2006
[4] The Japanese Institute of Certified Public Accountants, “Survey of Compensation of Auditors of Japanese Companies 2016” (Japanese only), 2016 April 13
[5] US litigation information: Stanford Law School http://securities.stanford.edu/filings.html
Japanese litigation information: Tokio Kaijo Nichido Risk Consulting, Risk Management Report 2014 Vol. 17. http://www.tokiorisk.co.jp/risk_info/up_file/201406131.pdf
[6] Nikkei 2013 July 22. URL http://www.nikkei.com/article/DGXNMSGD2201N_S3A720C1000000/
[7] “Necessity is the Mother of Invention. How a Culture Steeped in Tradition Deals with Change”, Jiro Yasu, 2015/3/24. Available upon request.
[8] Goldman Sachs, “Buy Back Monitor 2016”
[9] Buyback yield is defined as total buyback amount divided by total market capitalization